

Using Big Data
The dataset used for that project is an already polished and fairly large corpus by Maciej Szpakowski.
This is an open source dataset composed of millions of news articles mostly scraped from a curated list of 1001 domains from opensources.co1. Because the list does not contain any reliable websites, additionally NYTimes and Webhose English News Articles have been included to balance the classes better. The dataset is still work in progress, and for now, the public version includes only 9,408,908 articles (745 out of 1001 domains).
The available data has more than 26GB on disk when we unzip the file and more than 75GB in RAM using pandas. For that reason, I considered using dask. However, loading the CSV file ended in a ParserError (Error tokenizing data. C error: EOF inside string starting at row 63) and apparently, this is a known problem with dask’s read_csv if the file contains a newline character between quotes.
To read the CSV file with pandas, the same row (63) ended in a _csv.Error: field larger than field limit (131072). To address that error we have to first increase the csv.field_size_limit.
# _csv.Error: field larger than field limit (131072)
# https://stackoverflow.com/a/15063941/5983691
def csv_field_limit():
    maxInt = sys.maxsize
    decrement = True

    while decrement:
        # decrease the maxInt value by factor 10
        # as long as the OverflowError occurs.
        decrement = False
        try:
            csv.field_size_limit(maxInt)
        except OverflowError:
            maxInt = int(maxInt/10)
            decrement = True
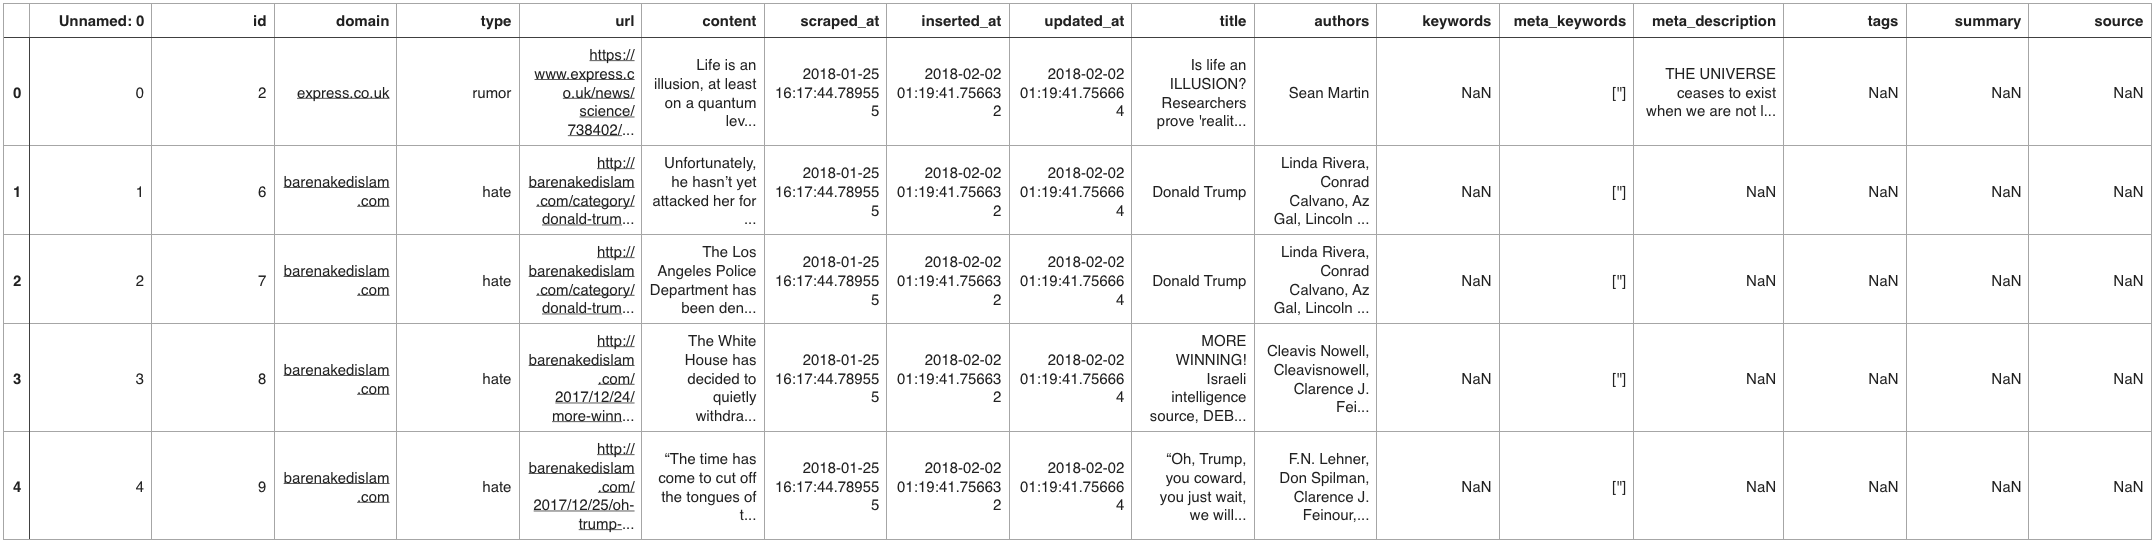
The dataset is not huge but is also larger than we’d like to manage on a laptop, especially if we value interactivity. In any case, let’s have a look at the first 100 rows to see what we have and determine what features we can drop and others we want to keep.
To fix the EOF problem, we can load in the dataset in chunks and loop that way through the dataset. Loading the CSV file in chunks helps but it is impractical to get a full picture of our data. With dask, we can utilise all the cores we have on our laptop.

Now we can get a quick view of what categories and how many we have in our dataset:
categories = ddf.category.value_counts().compute()
categories
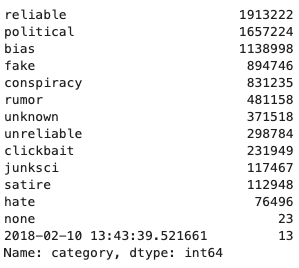
As we can see we need to do some cleaning. We have some oddly named categories and I also checked for null values. From our data exploration, we have a few handy functions to clean the data we will use here again. For example, remove all digits, HTML strings and stopwords from our text and to lemmatise the words.
To send the data to separate processes for processing, we can configure dask’s scheduler and set it globally. This option is useful when operating on pure Python objects like strings.
dask.config.set(scheduler='processes')
Parquet
To save disk space dask encourages dataframes (pandas) users like us to use Parquet. It is a columnar binary format that is easy to split into multiple files (easier for parallel loading) and is generally much simpler to deal with than compared to HDF5 a popular choice for Pandas users with high-performance needs. It is also a common format used by other big data systems like Apache Spark and Apache Impala.
For data-sets too big to fit conveniently into memory, like ours, we want to read it in line by line or iterate through the row-groups in a similar way to reading by chunks from CSV with pandas. For the latter, fastparquet makes it possible to do that using iter_row_groups API.
pf = ParquetFile('myfile.parq')
for df in pf.iter_row_groups():
    print(df.shape)
    # process sub-data-frame df
As an alternative option, I found the rows package by Álvaro Justen.
Deep Learning Model
For the initial model, I choose to create a Convolutional neural network (CNN) using keras:
model = Sequential([
	Conv1D(filters, kernel_size, input_shape=(input_shape[0], input_shape[1]),
		padding='valid', activation='relu', strides=1),
	GlobalMaxPooling1D(),
	Dense(hidden_dims),
	Dropout(0.2, activation='relu'),
	Dense(1, activation='sigmoid')
	])

model.compile(loss='binary_crossentropy', optimizer='adam', metrics=['accuracy'])
Also, to be able to read in the data I needed to create a custom generator to process each line in the CSV file:
def _generator_process_line(line):
    embedding = np.zeros((max_words, 100))

    for i, word in enumerate(line[0].split()[:max_words]):
        if word in glove:
            embedding[i] = glove[word]

    return embedding, line[1]

def Generator(data, batch_size):
    while True:
        with open(data, 'r') as f:
            # skip header
            for _ in range(1):
                next(f)

            batch_i = 0
            batch_embedding = np.zeros((batch_size, max_words, 100))
            batch_category = np.zeros((batch_size, 1))

            reader = csv.reader(f)
            for line in reader:
                embedding, category = _generator_process_line(line)

                if (batch_i + 1) == batch_size:
                    yield batch_embedding, batch_category

                    batch_embedding = np.zeros((batch_size, max_words, 100))
                    batch_category = np.zeros((batch_size, 1))
                    batch_i = 0
                else:
                    batch_embedding[batch_i] = embedding
                    batch_category[batch_i, 0] = category
                    batch_i += 1
The following code snippet trains the model on data generated batch-by-batch by the python generator above on one GPU.
with tf.device('/gpu:0'):
	history = model.fit_generator(Generator(train_data, batch_size),
					steps_per_epoch=train_size//batch_size,
					validation_data=Generator(valid_data, batch_size),
					validation_steps=valid_size//batch_size,
					epochs=epochs, verbose=1)
When we plot the training and validation accuracy (see below), we can see that the training went towards one while the validation leveled out around 0.98. Which shows that the model isn’t bad, but I didn’t really earn anything after just three epochs. It fits the training data very well but the validation data needed work. These results are borne out in the loss where we can see that after three epochs, my training loss went down nicely, but my validation loss climbed. So as it is, the model is about 98 percent accurate-ish after three epochs, and I don’t really need to train any further.
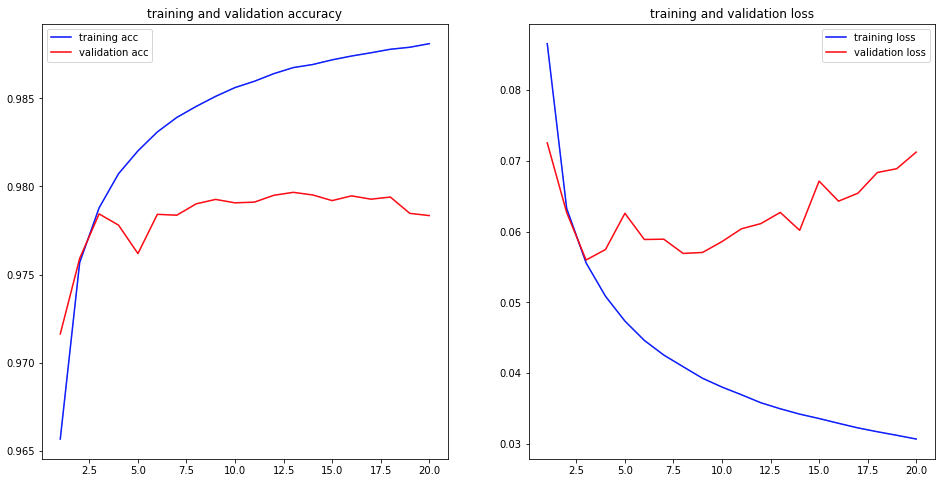
Question(s)? With about 98% accuracy, can we talk about overfitting here? Surely not. Or can we?
GPU
You may notice the with-statement and recall that I am working on a laptop. To train the model on the laptop is not manageable. To be able to train the model I used paperspace’s gradient service, which includes jupyter notebooks, a job runner, and a python module to run any code on Paperspace GPU cloud. The gradient machine I created is a Quadro P4000 with 8CPU’s and 30GB RAM. One epoch needed about 45 minutes to calculate.
Jupyter Notebook
Here is the notebook to that post.
What next?
- Iterate over the TensowFlow model to help improve our result.
- Create two more keras models, one which focuses on its “content” and the other model on its “context”. Furthermore, be able to predict what type of news article do we have - reliable or unreliable.
- As a bonus, I like to add linguistic analysis.
- Build a dashboard using Dash.